
Asset management
FluidViz™
Managed a GIS asset management and monitoring solution for water utilities, including EPA Lead and Copper service line inventory workflows.
View the StoryMapYour jobs, leads and customers already say where the money is. We turn them into dashboards and maps you can read at a glance, built on ten years of professional GIS work, with drone aerial mapping when you need the view from above.
Which services actually pay? Which zip codes call the most? Which ads bring jobs and which just bring clicks? Is that job worth the drive? A good dashboard answers those in seconds.
Our founder has spent a decade building GIS for cities, utilities, and emergency response, and we bring the same tools to organizations of any size.
Recent work
Managed a GIS asset management and monitoring solution for water utilities, including EPA Lead and Copper service line inventory workflows.
View the StoryMap
Built and managed a public map viewer where residents look up zoning, parcels, flood zones, and council districts.
View it live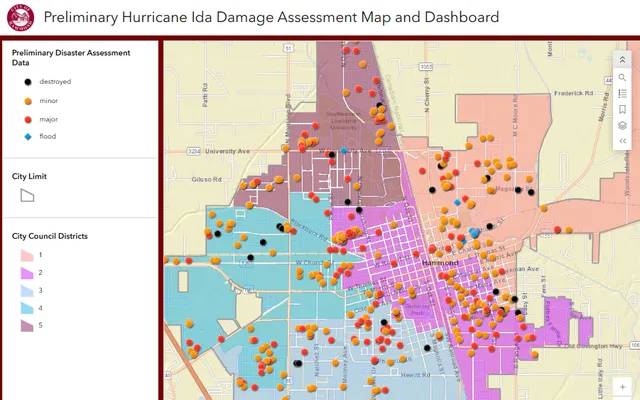
Built the city's preliminary damage map and dashboard, covering all five council districts.
View it liveTry it
Here's a year of jobs for a made-up service business. Type your own address to see it on a real map of your area, then switch the view and watch the question it answers change.
Every dot is a job. Useful, but it's hard to see a pattern when dots pile up.
Density shows where jobs cluster, so you know where the next door hanger, yard sign, or ad should go.
Rings show distance from the shop. 0% of jobs fall within the first ring, and 0 sit outside the outer ring.
Your version uses your real addresses and lives in a dashboard you can open anytime.
A map shows where your customers and jobs are, which neighborhoods bring in the most work, and which jobs are worth the drive. Heat maps and service-area rings turn a list of addresses into decisions about where to advertise and how far to travel.
Ten years of professional GIS: a public map viewer for the City of Hammond, Louisiana, the FluidViz asset management system for water utilities, and the city’s Hurricane Ida damage dashboard.
Yes. Aerial photos and drone mapping of sites, lots and properties are flown by our drone partner and delivered by us, ready to use in your maps and dashboards.
Whatever you already have: a spreadsheet of jobs, your invoicing or CRM export, or a list of customer addresses. We clean it up, connect it, and keep the dashboard updating on its own.
A custom map or dashboard starts at $1,500 one-time, a field data collection app starts at $1,000, and keeping a live dashboard updated is $300 a month. Every project gets a fixed quote before work starts.